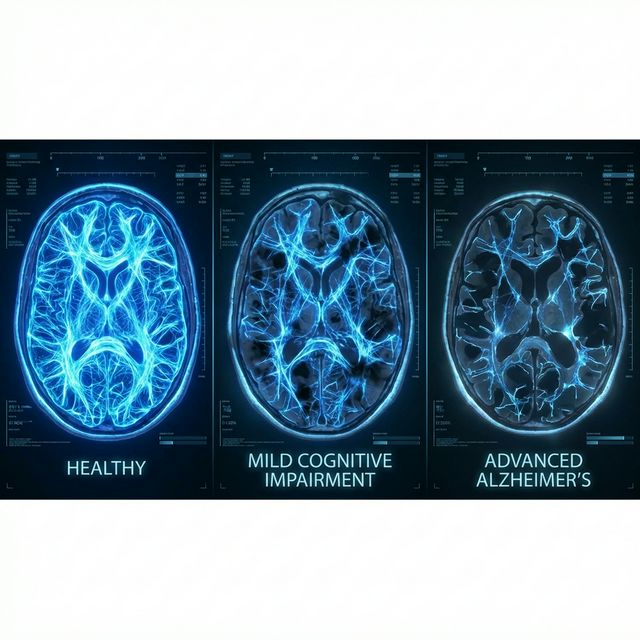
Following up on our work with mouse models of Alzheimer’s, we now turn to the human brain. If dynamic network failure is a hallmark of pathology in mice, can we see the same “blurring” and disintegration in human patients years before diagnosis?
Alzheimer’s disease doesn’t break the brain all at once.
Long before a clinical diagnosis, the brain’s major networks start drifting out of sync: subcortical systems lose their grip, control networks wobble, and the coordinated, repeating patterns that support healthy function begin to thin out.
In our recent work (presented at EMBC 2025), we asked a simple question with a technically loaded answer:
Can we track the progression of Alzheimer’s disease by looking at how the brain’s large-scale spatiotemporal patterns fall apart over time?
This post walks through the core ideas behind that study—what we measured, how we measured it, and why it matters for catching the disease earlier and tracking it more reliably.
The big idea: follow the brain’s recurring rhythms
Most clinical fMRI analysis still leans on static functional connectivity: average correlations across a 5–10 minute scan. That’s like judging city traffic patterns from a single long-exposure photo: you see structure, but you miss the dynamics, instability, and bottlenecks forming in real time.
We focus instead on Quasi-Periodic Patterns (QPPs):
- Repeating, large-scale waves of activity rolling through the brain over ~20–30 seconds.
- Captured directly from the data without seeds or predefined events.
- Previously shown to:
- Be robust across individuals and species.
- Relate to core networks like the default mode and attention systems.
- Differentiate disease states better than static connectivity in some animal models.
In this project, we treat QPPs as dynamic fingerprints of network integrity: if those patterns weaken, distort, or stop recurring, it’s a sign that the underlying functional networks are breaking down.
Data: stable vs. transitioning Alzheimer’s trajectories
We use resting-state fMRI data from the Alzheimer’s Disease Neuroimaging Initiative (ADNI) and split subjects into two broad tracks:
- Stable cohorts (Group 1)
- sNC: stable normal controls
- sMCI: stable mild cognitive impairment
- sDAT: stable dementia of Alzheimer’s type
- Transitioning cohorts (Group 2)
- uNC: individuals who progress from NC → MCI
- pMCI: individuals who progress from MCI → DAT
- For each, we label scans as:
- PRE: before diagnostic transition
- POST: after transition
We map all data into a standardized functional space using the NeuroMark v2.2 atlas, which organizes the brain into 105 intrinsic connectivity networks (ICNs) grouped into domains (cerebellar, visual, sensorimotor, subcortical, higher cognitive, triple-network, etc.).
This lets us ask: as people move along the AD spectrum, which networks’ spatiotemporal patterns fail first, and how does that failure spread?
Methods in plain language
The workflow is conceptually simple (the implementation is less cute):
- Extract QPPs
- Use QPPLab to identify recurring QPP templates from resting-state data.
- Each QPP template is a time-resolved pattern of activity across the 105 ICNs over a fixed window (~24 seconds).
- Project across groups
- For each disease stage, we:
- Derive its own QPP templates.
- Project those templates onto other groups’ data via sliding template correlation.
- This tests how often each template reappears and how faithfully it matches, across disease stages.
- For each disease stage, we:
- Quantify network integrity
- Compute correlation matrices from QPP templates.
- Compare:
- Self-correlations (template with itself) as a baseline.
- Cross-correlations between templates from different groups.
- Translate this into “network integrity” metrics:
- How much structure is preserved within and across networks.
- Use Kruskal–Wallis + Dunn’s post-hoc tests to identify statistically reliable differences across stages.
The result: a dynamic connectivity readout that doesn’t just say “these regions are less connected,” but “these recurring, organizing patterns of brain activity are collapsing in specific networks as disease advances.”
What we found (without the full wall of matrices)
1. Stable groups follow a clear breakdown trajectory
Across sNC → sMCI → sDAT, we see a progressive loss of network integrity in QPP dynamics:
- Early hits:
- Paralimbic regions
- Extended thalamic subcortical circuits
- Frontal and insular-temporal higher-order networks
-
These are systems involved in memory, executive control, emotional regulation, attention.
- Later stages (sDAT):
- Disruptions spread into:
- Cerebellar domains
- Visual networks
- Temporoparietal association areas
- Core triple-network components (default mode, central executive)
- QPP-based connectivity shows widespread disconnection, not just subtle weakening.
- Disruptions spread into:
Static connectivity alone struggles to tell this story cleanly. QPP-based measures make the progression more structurally explicit.
2. Transitioning groups show trouble early
The transitioning cohorts—those who haven’t yet “officially” converted at the time of some scans—are the interesting ones.
Key observation:
- Even before formal diagnosis:
- uNC and pMCI groups show earlier disruptions in:
- Visual networks (occipital and occipitotemporal)
- Cerebellar networks
- Sensorimotor systems
- uNC and pMCI groups show earlier disruptions in:
In other words, the dynamic patterns start failing in sensory and cerebellar circuits before full-blown cognitive deficits are stamped into the chart.
This suggests these domains may act as early-warning sites: if their QPP signatures are degrading, a person may be on a path toward symptomatic Alzheimer’s—even if traditional readouts still look “okay.”
3. QPP occurrences decline with disease severity
When we count how often QPPs show up:
- Healthy and early-stage groups:
- Frequent, well-formed QPP recurrences.
- More advanced and transitioning groups:
- Fewer occurrences
- Less coherent projections
This drop in QPP occurrence and fidelity lines up with the idea that AD is not just about isolated regional damage, but a loss of the brain’s ability to maintain large-scale, organized, time-varying coordination.
That shift—from flexible, rhythmic dynamics to sparse, unstable patterns—is exactly the kind of signal we want if we’re trying to detect disease progression earlier and more robustly.
Why this matters
A few reasons this framework is promising:
-
Dynamic, not static
QPPs capture transient instabilities that static connectivity averages away. - Network- and pattern-level view
Instead of “this edge is weaker,” we see:- How whole-brain motifs change.
- Which networks stop participating in those motifs.
- How that evolves across longitudinal trajectories.
- Compatible with real clinical data
- Works on standard ADNI-style scans (TR=3s, multi-site, real-world noise).
- Uses an atlas (NeuroMark) explicitly built for reproducibility at scale.
- Path to biomarkers
- Declining QPP occurrence + disrupted projections offer:
- A candidate functional biomarker for staging.
- A way to track who is drifting toward impairment before classic metrics fully tip.
- Declining QPP occurrence + disrupted projections offer:
This is not a clinical tool yet. But it’s a concrete step toward time-resolved, network-aware markers that reflect how Alzheimer’s truly unfolds in the brain.
Limitations (the honest version)
A few constraints worth stating out loud:
- Temporal resolution (TR=3s) limits sensitivity to faster dynamics.
- Transitioning groups are relatively small compared to stable cohorts.
- QPP detection and projection choices (window size, thresholds) can influence outcomes and should be stress-tested.
- There’s room to:
- Integrate with cPCA, autoencoders, or other sequence models.
- Use higher-resolution datasets.
- Combine QPP metrics with structural, molecular, or cognitive markers.
So: promising, but deliberately conservative.
Where this is heading
The larger trajectory here is straightforward:
- Treat large-scale spatiotemporal patterns as first-class signals, not side effects.
- Use tools like QPPs to:
- Identify early functional fractures in at-risk individuals.
- Track how interventions (pharmacological or behavioral) impact network stability.
- Build multimodal biomarkers that respect the brain as a dynamic system.
Alzheimer’s is not just “less connectivity.” It is a progressive loss of coordinated, rhythmic, large-scale brain behavior.
If we want to catch it early, we have to look where that coordination lives—in the patterns that repeat, and in how they fail.